1
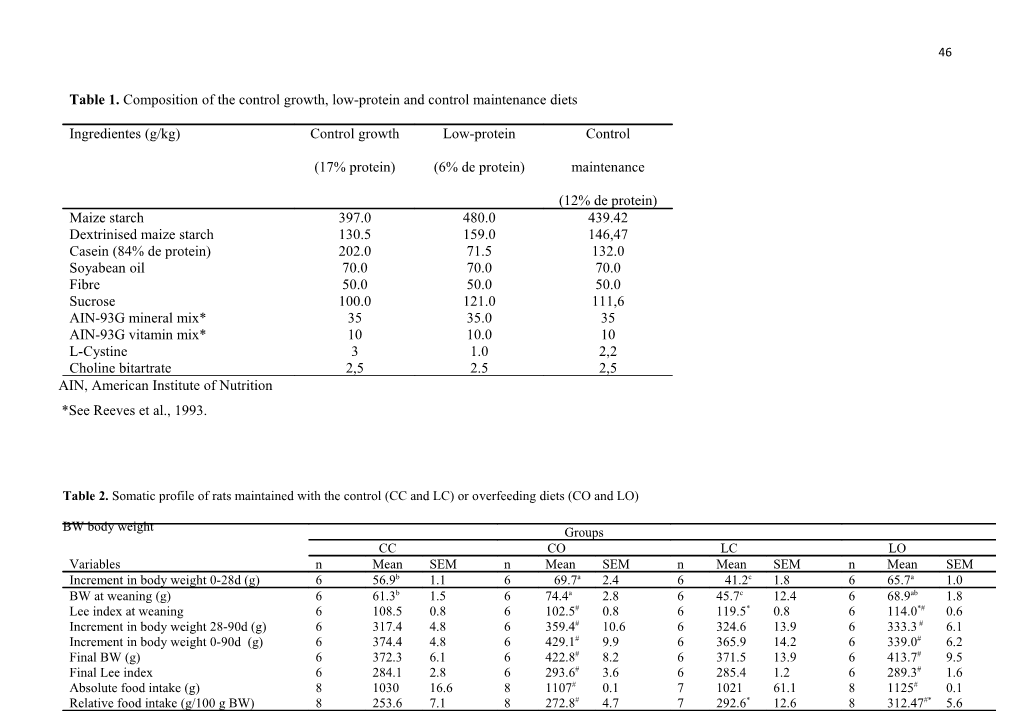
Table 1. Composition of the control growth, low-protein and control maintenance diets
Ingredientes (g/kg) / Control growth(17% protein) / Low-protein
(6% de protein) / Control maintenance
(12% de protein)
Maize starch / 397.0 / 480.0 / 439.42
Dextrinised maize starch / 130.5 / 159.0 / 146,47
Casein (84% de protein) / 202.0 / 71.5 / 132.0
Soyabean oil / 70.0 / 70.0 / 70.0
Fibre / 50.0 / 50.0 / 50.0
Sucrose / 100.0 / 121.0 / 111,6
AIN-93G mineral mix* / 35 / 35.0 / 35
AIN-93G vitamin mix* / 10 / 10.0 / 10
L-Cystine / 3 / 1.0 / 2,2
Choline bitartrate / 2,5 / 2.5 / 2,5
AIN, American Institute of Nutrition
*See Reeves et al., 1993.
Table 2.Somatic profile of rats maintained with the control (CC and LC) or overfeedingdiets (CO and LO)
GroupsCC / CO / LC / LO
Variables / n / Mean / SEM / n / Mean / SEM / n / Mean / SEM / n / Mean / SEM
Increment in body weight 0-28d (g) / 6 / 56.9b / 1.1 / 6 / 69.7a / 2.4 / 6 / 41.2c / 1.8 / 6 / 65.7a / 1.0
BW at weaning (g) / 6 / 61.3b / 1.5 / 6 / 74.4a / 2.8 / 6 / 45.7c / 12.4 / 6 / 68.9ab / 1.8
Lee index at weaning / 6 / 108.5 / 0.8 / 6 / 102.5# / 0.8 / 6 / 119.5* / 0.8 / 6 / 114.0*# / 0.6
Increment in body weight 28-90d (g) / 6 / 317.4 / 4.8 / 6 / 359.4# / 10.6 / 6 / 324.6 / 13.9 / 6 / 333.3 # / 6.1
Increment in body weight 0-90d (g) / 6 / 374.4 / 4.8 / 6 / 429.1# / 9.9 / 6 / 365.9 / 14.2 / 6 / 339.0# / 6.2
Final BW (g) / 6 / 372.3 / 6.1 / 6 / 422.8# / 8.2 / 6 / 371.5 / 13.9 / 6 / 413.7# / 9.5
Final Lee index / 6 / 284.1 / 2.8 / 6 / 293.6# / 3.6 / 6 / 285.4 / 1.2 / 6 / 289.3# / 1.6
Absolute food intake (g) / 8 / 1030 / 16.6 / 8 / 1107# / 0.1 / 7 / 1021 / 61.1 / 8 / 1125# / 0.1
Relative food intake (g/100 g BW) / 8 / 253.6 / 7.1 / 8 / 272.8# / 4.7 / 7 / 292.6* / 12.6 / 8 / 312.47#* / 5.6
BW body weight
abcMean values with unlike superscript letters were significantly different (P0·05; two-way ANOVA followed by least significant difference (LSD) test).
* Mean values were significantly different from those of the control rats (P<0·05; two-way ANOVA).
# Mean values were significantly different from those of the non-overfeeding rats (P<0·05; two-way ANOVA).
n Numbers of rats.
Table 3. Oxygen consumption (O2), carbon dioxide production (CO2), respiratory quotient (RQ) and spontaneous activity was measuredof rats maintained with the
GroupsCC / CO / LC / LO
Variables / n / Mean / SEM / n / Mean / SEM / n / Mean / SEM / n / Mean / SEM
CO2 production (ml/mim/kg 0,75) / 6 / 56.9 / 1.3 / 6 / 63.2# / 1.3 / 6 / 52,5* / 1.5 / 6 / 59.4*# / 1.5
O2 consumption (ml/mim/kg 0,75) / 6 / 67.9 / 1.5 / 6 / 75.6# / 1.8 / 6 / 62.9* / 1.2 / 6 / 70.5*# / 2.0
RQ (VCO2/VO2) / 6 / 0.84 / 0.1 / 6 / 0.84 / 0.1 / 6 / 0.83 / 0.1 / 6 / 0.84 / 0.1
Activity / 6 / 6609 / 368 / 6 / 7223 / 515 / 6 / 5534* / 563.0 / 6 / 4683* / 407
control (CC and LC) or overfeeding diets (CO and LO)
* Mean values were significantly different from those of the control rats (P<0·05; two-way ANOVA).
# Mean values were significantly different from those of the non-overfeeding rats (P<0·05; two-way ANOVA).
n Numbers of rats.
Table 4. Weight and lipid content in the white and brown adipose tissues (BAT) of rats maintained with the control (CC and LC) or overfeeding diets (CO and LO)
GroupsCC / CO / LC / LO
Variables / n / Mean / SEM / n / Mean / SEM / n / Mean / SEM / n / Mean / SEM
Weight IBAT (g) / 6 / 0.468 / 0.1 / 6 / 0.391# / 0.1 / 6 / 0.652* / 0.1 / 6 / 0.501*# / 0.1
Lipid content IBAT (g/total tissue) / 6 / 0.20 / 0.1 / 6 / 0.16# / 0.1 / 6 / 0.34* / 0.1 / 6 / 0.23*# / 0.1
Lipid content IBAT (g/100g tissue) / 6 / 48.7 / 3.2 / 6 / 50.1 / 3.4 / 6 / 61.3* / 2.1 / 6 / 52.5* / 4.4
Weight RWAT (g) / 6 / 9.1 / 0.5 / 6 / 12.1# / 0.8 / 6 / 10.1 / 0.4 / 6 / 12.5# / 0.9
Weight RWAT (g/100gBW) / 6 / 2.5 / 0.1 / 6 / 2.6# / 0.3 / 6 / 2.7* / 0.1 / 6 / 3.10*# / 0.1
Lipid content RWAT (g/total tissue) / 8 / 3.5 / 0.3 / 7 / 4.9# / 0.4 / 7 / 3.7 / 0.4 / 8 / 4.1# / 0.3
Lipid content RWAT (g/100g tissue) / 8 / 39.6 / 2.1 / 7 / 38.0 / 1.5 / 7 / 38.6 / 2.5 / 8 / 33.6 / 1.3
Weight EWAT (g) / 6 / 6.6 / 0.5 / 6 / 8.7# / 0.7 / 6 / 8.3 / 0.7 / 6 / 9.7# / 0.8
Weight EWAT (g/100gBW) / 6 / 1.8b / 0.1 / 6 / 2.2a / 0.1 / 6 / 2.4a / 0.1 / 6 / 2.2a / 0.2
Lipid content EWAT (g/total tissue) / 8 / 2.8 / 0.1 / 8 / 3.3# / 0.2 / 7 / 2.7 / 0.3 / 8 / 3.2# / 0.2
Lipid content EWAT (g/100g tissue) / 8 / 35.7 / 0.8 / 8 / 36.4 / 0.6 / 6 / 34.3 / 1.2 / 7 / 34.3 / 0.7
BW, body weight; RWAT, retroperitoneal white adipose tissue; EWAT, epididymal white adipose tissue
abMean values with unlike superscript letters were significantly different (P<0·05; two-way ANOVA followed by least significant difference (LSD) test).
* Mean values were significantly different from those of the control rats (P<0·05; two-way ANOVA).
# Mean values were significantly different from those of the non-overfeeding rats (P<0·05; two-way ANOVA).
n Numbers of rats.
Table 5.Biochemical parametersof rats maintained with the control (CC and LC) or overfeeding diets (CO and LO)
GroupsCC / CO / LC / LO
Variables / n / Mean / SEM / n / Mean / SEM / n / Mean / SEM / n / Mean / SEM
Triglycerides (mg/dl) / 6 / 181.4 / 16.4 / 5 / 84.2# / 7.8 / 6 / 190.9* / 12.2 / 6 / 156.5* # / 21.9
LDL- cholesterol (mg/dl) / 6 / 26.6 / 4.2 / 6 / 33.0 / 3.4 / 6 / 30.8 / 4.7 / 6 / 30.5 / 2.3
HDL- cholesterol (mg/dl) / 6 / 23.6 / 0.6 / 6 / 20.1 / 1.9 / 6 / 24.6 / 1.2 / 6 / 23.5 / 0.9
Total cholesterol (mg/dl) / 6 / 86.5 / 3.3 / 6 / 86.3 / 12.5 / 6 / 93.6 / 7.4 / 6 / 85.2 / 4.4
Castelli I / 6 / 3.7 / 0.1 / 6 / 3.9 / 0.1 / 6 / 3.8 / 0.2 / 6 / 3.6 / 0.1
Castelli II / 6 / 1.1b / 0.2 / 6 / 2.1a / 0.2 / 6 / 1.2 b / 0.2 / 6 / 1.3b / 0.1
FFA (μmol/l) / 6 / 0.99 / 0.1 / 6 / 0.72# / 0.1 / 6 / 0.88 / 0.0 / 6 / 0.84# / 0.0
FFA, free fatty acid.
abcMean values with unlike superscript letters were significantly different (P<0·05; two-way ANOVA followed by least significant difference (LSD) test).
* Mean values were significantly different from those of the control rats (P<0·05; two-way ANOVA).
# Mean values were significantly different from those of the non-overfeeding rats (P<0·05; two-way ANOVA).
n Numbers of rats
Table 6.Fasting serum glucose and insulin concentration, total area under the glucose (AUG) and insulin (AUI) curves, glucose disappearance ratio (Kitt) obtained from the intraperitoneal insulin tolerance test and HOMA-IR of rats maintained with the control (CC and LC) or overfeeding diets (CO and LO)
GroupsCC / CO / LC / LO
Variables / n / Mean / SEM / n / Mean / SEM / n / Mean / SEM / n / Mean / SEM
Basal glucose (mmol/l) / 7 / 7.0 / 0.1 / 7 / 7.1 / 0.1 / 3 / 6.8 / 0.0 / 6 / 7.0 / 0.1
Basal insulin (pmol/l) / 7 / 14.8b / 0.8 / 7 / 35.3a / 2.3 / 3 / 34.6 a / 1.3 / 6 / 3.3 c / 0.7
AUG (mmol/L.120min) / 7 / 2065 / 31 / 4 / 2278# / 95 / 7 / 2075 / 27 / 7 / 2183# / 52
AUI (pmol/L.120 min) / 7 / 56 b / 4 / 4 / 200 a / 53 / 7 / 173 a / 44 / 7 / 78 b / 3
Kitt (%/min) / 8 / 0.28 b / 0.2 / 8 / 2.79 a / 0.6 / 7 / 3.05 a / 0.3 / 8 / 3.13 a / 0.4
HOMA-IR / 7 / 4.6 b / 0.3 / 7 / 11.1 a / 0.7 / 3 / 10.4 a / 0.4 / 6 / 1.0 c / 0.2
Leptin (μU/ml) / 5 / 12.1 / 1.6 / 5 / 11.8 / 1.2 / 5 / 10.8 / 0.4 / 5 / 10.2 / 0.5
abcMean values with unlike superscript letters were significantly different (P<0·05; two-way ANOVA followed by least significant difference (LSD) test).
*# Mean values were significantly different from those of the control rats (P<0·05; two-way ANOVA).
n Numbers of rats.