Longitudinal Change in CSF Tau and Aβ Biomarkersfor up to 48 Months in ADNI
Jon B. Toledo, Sharon X. Xie, John Q. Trojanowski and Leslie M Shaw, for the Alzheimer’s Disease Neuroimaging Initiative
Methods
ADNI description and goals
The primary goal of ADNI has been to test whether serial MRI [1,6], PET [2], other biological markers [5], and clinical and neuropsychological assessment [4] can be combined to measure the progression of MCI and early AD. Determination of sensitive and specific markers of very early AD progression is intended to aid researchers and clinicians to develop new treatments and monitor their effectiveness, as well as lessen the time and cost of clinical trials. The Principal Investigator of this initiative is Michael W. Weiner, MD, VA Medical Center and University of California – San Francisco. ADNI is the result of efforts of many co-investigators from a broad range of academic institutions and private corporations.
Recruitment inclusion and exclusion criteria for ADNI 1
Inclusion criteria were as follows: 1) Hachinski Ischemic Score ≤4; 2) Permitted medications
stable for 4 weeks prior to screening; 3) Geriatric Depression Scale score < 6; 4) visual and auditory acuity adequate for neuropsychological testing; good general health with no diseases precluding enrollment; 5) 6 grades of education or work history equivalent; 6) Ability to speak English or Spanish fluently; 7) A study partner with 10 hr per week of contact either in person or on the telephone and who could accompany the participant to the clinical visits.
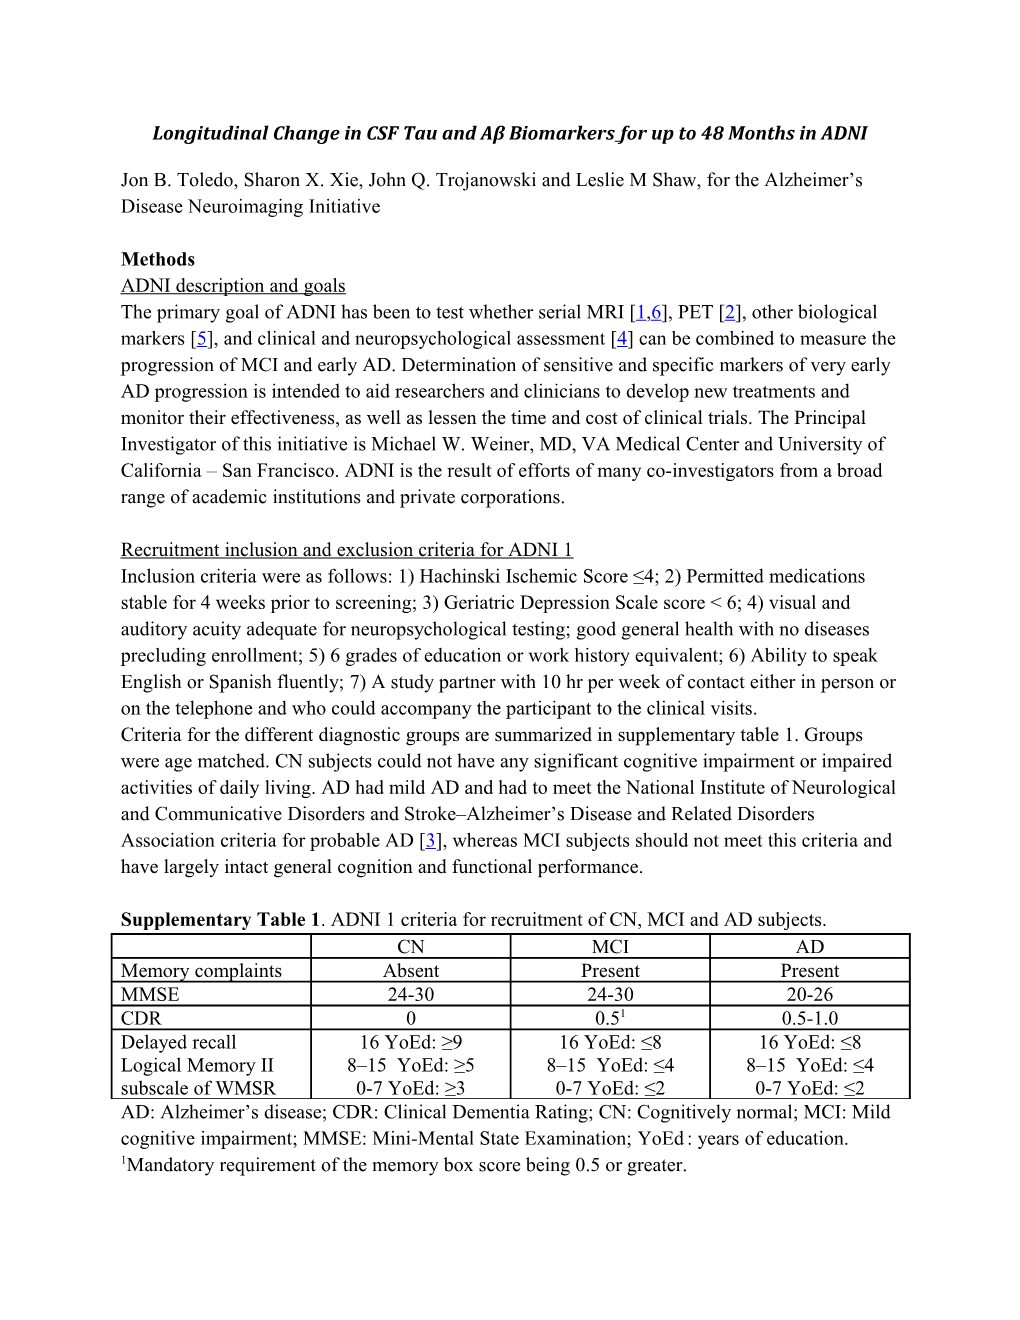
Criteria for the different diagnostic groups are summarized in supplementary table 1. Groups were age matched. CN subjects could not have any significant cognitive impairment or impaired activities of daily living. AD had mild AD and had to meet the National Institute of Neurological and Communicative Disorders and Stroke–Alzheimer’s Disease and Related Disorders Association criteria for probable AD [3], whereas MCI subjects should not meet this criteria and have largely intact general cognition and functional performance.
Supplementary Table 1. ADNI 1 criteria for recruitment of CN, MCI and AD subjects.
CN / MCI / ADMemory complaints / Absent / Present / Present
MMSE / 24-30 / 24-30 / 20-26
CDR / 0 / 0.51 / 0.5-1.0
Delayed recall Logical Memory II subscale of WMSR / 16 YoEd: ≥9
8–15 YoEd: ≥5
0-7 YoEd: ≥3 / 16 YoEd: ≤8
8–15 YoEd: ≤4
0-7 YoEd: ≤2 / 16 YoEd: ≤8
8–15 YoEd: ≤4
0-7 YoEd: ≤2
AD: Alzheimer’s disease; CDR: Clinical Dementia Rating; CN: Cognitively normal; MCI: Mild cognitive impairment; MMSE: Mini-Mental State Examination; YoEd: years of education. 1Mandatory requirement of the memory box score being 0.5 or greater.
Supplementary Table 2. Clinical characteristics of subjects with normal baseline Aβ1-42 values but differences in longitudinal biomarker changes stratified by clinical diagnosis.
CN / p-value / MCI / p-valueLongitudinal Aβ1-42 group / Stable
(n=15) / Decrease
(n=6) / Stable
(n=5) / Decrease
(n=8)
Age (years)1 / 77.3 (6.6) / 77.8 (2.1) / 0.91 / 79.5 (5.6) / 76.4 (7.2) / 0.5
Gender (male %) / 53% / 17% / 0.19 / 75% / 88% / 1.0
APOE ε4 (%) / 6.7% / 0% / 1.0 / 0% / 0% / 1.0
ADAS-Cog / 8.4 (3.1) / 6.9 (4.8) / 0.35 / 12.8 (2.7) / 15.9 (3.9) / 0.27
Aβ1-42 (pg/ml)2 / 273.0 (245.5-284.5) / 233.5 (229.3-242.3) / 0.014 / 258.0 (254.8-260.8) / 254.5 (243.8-261.3) / 0.61
T-tau (pg/ml)2 / 56.0 (53.0-60.0) / 78.5 (67.3-88.3) / 0.07 / 70.0 (64.8-74.8) / 67.5 (48.0-80.3) / 0.73
P-tau181 (pg/ml)2 / 18.0 (15.0-22.0) / 27.0 (19.5-34.5) / 0.09 / 18.5 (16.0-20.0) / 16.0 (15.0-20.3) / 0.86
CN: Cognitively normal subjects; MCI: Mild cognitive impairment subjects; ADAS-Cog : Alzheimer’s disease Assessment Scale-cognitive subscale
Supplementary Table 3.Clinical characteristics of subjects with normal baseline p-tau181 values but differences in longitudinal biomarker changes stratified by clinical diagnosis.
CN / p-value / MCI / p-valueLongitudinal p-tau181group / Stable
(n=16) / Increase
(n=3) / Stable (n=8) / Increase
(n=3)
Age (years)1 / 76.7 (5.5) / 73.7 (4.0) / 0.23 / 77.9 (4.0) / 71.0 (9.5) / 0.22
Gender (male %) / 60% / 33% / 0.35 / 75% / 100% / 1.0
APOE ε4 (%) / 0% / 20% / 1.0 / 0% / 0% / 1.0
ADAS-Cog / 9.4 (2.9) / 10.6 (3.1) / 0.31 / 16.5 (5.3) / 12.8 (2.6) / 0.22
Aβ1-42 (pg/ml)2 / 240.0 (208.0-267.5) / 245.0 (188.5-260.0) / 0.86 / 252.0 (239.5-257.0) / 265.0 (260.5-280.0) / 0.051
T-tau (pg/ml)2 / 55.0 (52.5-57.5) / 58.0 (50.0-74.0) / 0.63 / 56.5 (48.0-70.3) / 80.0 (60.0-83.0) / 0.41
P-tau181 (pg/ml)2 / 16.0 (15.0-18.0) / 18.0 (17.5-19.5) / 0.08 / 16.0 (15.0-18.3) / 11.0 (10.5-16.0) / 0.40
CN: Cognitively normal subjects; MCI: Mild cognitive impairment subjects; ADAS-Cog : Alzheimer’s disease Assessment Scale-cognitive subscale
Supplementary Table 4. Longitudinal Aβ1-42 changes in the model with all the subjects and the model that excluded the Aβ1-42stable group (Aβ-SG) with normal baseline Aβ1-42 values.
Time (years) / Aβ1-42 (pg/ml)Model with all subjects / Aβ1-42 (pg/ml)
Model excluding Aβ-SG with normal baseline Aβ1-42
0 / 295.0 / 295.0
1 / 291.3 / 282.7
2 / 287.5 / 269.8
3 / 283.6 / 256.5
4 / 279.4 / 243.2
5 / 275.1 / 230.2
6 / 270.5 / 218.0
7 / 265.7 / 206.6
8 / 260.5 / 196.5
9 / 255.0 / 187.5
10 / 249.2 / 179.6
11 / 243.1 / 172.8
12 / 236.7 / 167.0
13 / 230.0 / 161.9
14 / 223.1 / 157.6
15 / 216.1 / 153.9
16 / 209.0 / 150.7
17 / 202.0 / 147.9
18 / 195.2 / 145.5
19 / 188.6 / 143.4
20 / 182.4 / 141.6
21 / 176.5 / 140.0
22 / 171.1 / 138.7
23 / 166.1 / 137.5
24 / 161.6 / 136.4
25 / 157.5 / 135.5
26 / 153.8 / 134.6
27 / 150.5 / 133.9
28 / 147.6 / 133.3
29 / 145.0 / 132.7
30 / 142.6 / 132.2
31 / 140.5 / 131.7
32 / 138.7 / 131.3
33 / 137.1 / 131.0
Supplementary Table 5. Longitudinal p-tau181 changes in the model with all the subjects and the model that excluded the p-tau181stable group (PT-SG) with normal baseline p-tau181 values.
Time (years) / P-Tau181 (pg/ml)Model with all subjects / P-Tau181 (pg/ml)
Model excluding PT-SG with normal baseline p-tau181
0 / 10.0 / 10.0
1 / 11.6 / 15.1
2 / 13.4 / 19.6
3 / 15.3 / 23.8
4 / 17.4 / 27.8
5 / 19.8 / 31.8
6 / 22.4 / 35.9
7 / 25.3 / 40.2
8 / 28.6 / 44.6
9 / 32.3 / 49.2
10 / 36.3 / 53.9
11 / 40.7 / 58.5
12 / 45.4 / 62.8
13 / 50.2 / 66.8
14 / 54.9 / 70.1
15 / 59.4
16 / 63.4
17 / 67.0
18 / 70.2
Supplementary Table 6. Counts of subjects stratified by changes in Aβ1-42 based on baseline normal or abnormal Aβ1-42 values and cognitive diagnosis.
Clinical diagnosis / Normal Aβ1-42 baseline / Abnormal Aβ1-42baselineStable Aβ1-42 / Decrease Aβ1-42 / Stable Aβ1-42 / Decrease Aβ1-42
CN stable / 12 / 6 / 8 / 2
MCI stable / 2 / 4 / 7 / 2
AD stable / 0 / 0 / 6 / 0
CN to MCI / 3 / 0 / 5 / 0
CN to AD / 0 / 0 / 2 / 0
MCI to AD / 1 / 2 / 20 / 2
MCI to CN / 1 / 2 / 1 / 0
Supplementary Table 7. Counts of subjects stratified by changes in P-tau181p based on baseline normal or abnormal P-tau181p values and cognitive diagnosis in subjects with normal Aβ1-42 baseline.
Normal Aβ1-42 baselineClinical diagnosis / Normal P-tau baseline / Abnormal P-tau baseline
Stable P-tau181p / Increase P-tau181p / Stable P-tau181p / Increase P-tau181p
CN stable / 9 / 2 / 3 / 4
MCI stable / 5 / 0 / 0 / 1
AD stable / 0 / 0 / 0 / 0
CN to MCI / 2 / 0 / 1 / 0
CN to AD / 0 / 0 / 0 / 0
MCI to AD / 1 / 2 / 0 / 0
MCI to CN / 2 / 1 / 0 / 0
Supplementary Table 8. Counts of subjects stratified by changes in P-tau181p based on baseline normal or abnormal P-tau181p values and cognitive diagnosis in subjects with abnormal Aβ1-42 baseline.
Abnormal Aβ1-42 baselineClinical diagnosis / Normal P-tau181p baseline / Abnormal P-tau181p baseline
Stable P-tau181p / Increase P-tau181p / Stable P-tau181p / Increase P-tau181p
CN stable / 3 / 1 / 0 / 6
MCI stable / 1 / 0 / 2 / 6
AD stable / 0 / 0 / 1 / 4
CN to MCI / 2 / 2 / 1 / 0
CN to AD / 0 / 0 / 2 / 0
MCI to AD / 0 / 1 / 10 / 9
MCI to CN / 0 / 0 / 0 / 1
Supplementary Figure 1. Baseline visit Aβ1-42 (a), t-tau (b) and p-tau181 (c) CSF values (x-axis) against their absolute change (y-axis) during a follow-up of 36 months to 48 months for cognitively normal subjects (CN in red), mild cognitive impairment subjects (MCI, in green) subjects and Alzheimer’s disease (AD in blue) subjects.
References
1. Jack CR, Jr., Bernstein MA, Fox NC, Thompson P, Alexander G, Harvey D, Borowski B, Britson PJ, J LW, Ward C, Dale AM, Felmlee JP, Gunter JL, Hill DL, Killiany R, Schuff N, Fox-Bosetti S, Lin C, Studholme C, DeCarli CS, Krueger G, Ward HA, Metzger GJ, Scott KT, Mallozzi R, Blezek D, Levy J, Debbins JP, Fleisher AS, Albert M, Green R, Bartzokis G, Glover G, Mugler J, Weiner MW (2008) The Alzheimer's Disease Neuroimaging Initiative (ADNI): MRI methods. J Magn Reson Imaging 27 (4):685-691. doi:10.1002/jmri.21049
2. Jagust WJ, Bandy D, Chen K, Foster NL, Landau SM, Mathis CA, Price JC, Reiman EM, Skovronsky D, Koeppe RA (2010) The Alzheimer's Disease Neuroimaging Initiative positron emission tomography core. Alzheimers Dement 6 (3):221-229. doi:10.1016/j.jalz.2010.03.003
3. McKhann G, Drachman D, Folstein M, Katzman R, Price D, Stadlan EM (1984) Clinical diagnosis of Alzheimer's disease: report of the NINCDS-ADRDA Work Group under the auspices of Department of Health and Human Services Task Force on Alzheimer's Disease. Neurology 34 (7):939-944
4. Petersen RC, Aisen PS, Beckett LA, Donohue MC, Gamst AC, Harvey DJ, Jack CR, Jr., Jagust WJ, Shaw LM, Toga AW, Trojanowski JQ, Weiner MW (2010) Alzheimer's Disease Neuroimaging Initiative (ADNI): clinical characterization. Neurology 74 (3):201-209. doi:10.1212/WNL.0b013e3181cb3e25
5. Shaw LM, Vanderstichele H, Knapik-Czajka M, Clark CM, Aisen PS, Petersen RC, Blennow K, Soares H, Simon A, Lewczuk P, Dean R, Siemers E, Potter W, Lee VM, Trojanowski JQ (2009) Cerebrospinal fluid biomarker signature in Alzheimer's disease neuroimaging initiative subjects. Ann Neurol 65 (4):403-413. doi:10.1002/ana.21610
6. Weiner MW, Veitch DP, Aisen PS, Beckett LA, Cairns NJ, Green RC, Harvey D, Jack CR, Jagust W, Liu E, Morris JC, Petersen RC, Saykin AJ, Schmidt ME, Shaw L, Siuciak JA, Soares H, Toga AW, Trojanowski JQ (2012) The Alzheimer's Disease Neuroimaging Initiative: a review of papers published since its inception. Alzheimers Dement 8 (1 Suppl):S1-68. doi:10.1016/j.jalz.2011.09.172