1
2.7 The Analysis of Variance (F-test) to Regression Analysis
We have the following 2 models:
Horizontal:
Line :
Note:The object function for the model 1 is . Thus, the estimate of the parameter can be obtained by solving . is the solution. =.
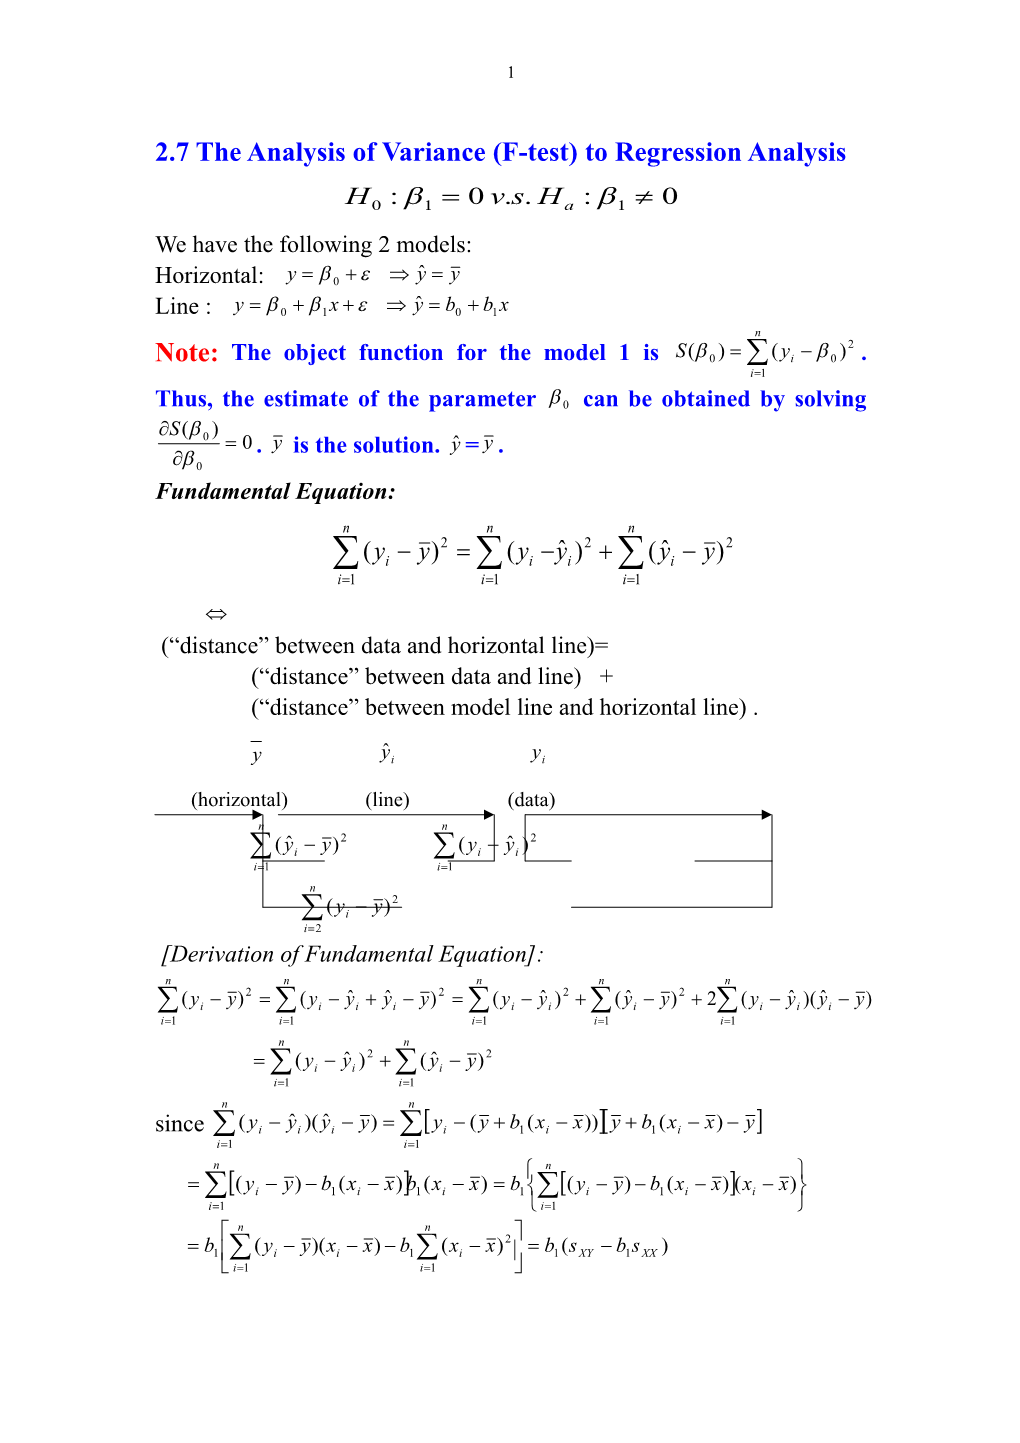
Fundamental Equation:
(“distance”between data and horizontal line)=
(“distance” between data and line) +
(“distance” between model line and horizontal line) .
(horizontal) (line) (data)
[Derivation of Fundamental Equation]:
since
The ANOVA (Analysis of Variance) table corresponding to the fundamental equation:
Source / df / SS / MSDue to regression
/ 1 / /
Residual (Error) / n-2 / /
Total (corrected) / n-1 /
Let
,
the ratio of the mean sum of squares due to the regression and mean residual sum of squares. Intuitively, large F value might imply the difference between the line and the horizontal line is relatively large to the random variation reflected by the mean residual sum of squares. That is, is so significant such that the difference between the line and the horizontal line are apparent. Therefore, the F value can provide important information about if .
Next question to ask: how large value of F can be considered to be large? To test ,
Note:The sum ofsquares due to the regression and the mean sum of squares due to regression are .
The total sum of squares is
Thus, the f statistic is .
Note:For ease of computation, the following equations can be used:
.
Note:.
Note:Let t be the statistic for testing . Then, .
Motivating Example (continue):
Assume . To test , we have the following:
Thus, we have the following ANOVA table
Source / df / SS / MS / fRegression / 1 / SSR=14200 / /
Residual (Error) / n-2=8 / SSE=1530 /
Total (corrected) / 9 / 15730
Since
,
we reject . Note that
.
Example 2 (continue):
Suppose the model is
,
and
(a)Provide an ANOVA table.
(b)Find the 95% confidence interval for .and use the confidence interval to test .
[solution:]
(a)
Since
The ANOVA table is
Source / df / SS / MSResidual (Error) / n-2=18 / SSE=3.848 /
Regression / 1 / SSR=49.220 /
Total (corrected) / 19 / 53.068
(b) The 95% confidence interval for is
.
Since , we reject .
Example 3:
Given are 5 observations for two variables x and y.
/ 2 / 3 / 5 / 1 / 8/ 25 / 25 / 20 / 30 / 16
Suppose the model is
,
(a)Find the least square estimate and the fitted regression equation
(b)Provide an ANOVA table and use F statistic to test at .
(c) Use t statistic to test at .
(d)Find the 95% confidence interval for .and use the confidence interval to test .
[solutions:]
(a)Since
thus,
Then, the least square estimate is
The fitted regression equation is
.
(b)
Since
The ANOVA table is
Source / df / SS / MS / FRegression / 1 / SSR=108.467 / /
Residual (Error) / n-2=3 / SSE=6.333 /
Total (corrected) / n-1=4 / SST=114.8
Since , we reject .
(c)
.
Since
,
we do not reject .
(d)
The 95% confidence interval for is
.
Since , we do not reject .