The Efficient Frontier and Portfolio Diversification
Volatility increases your risk of loss of principal, and this risk worsens as your time horizon shrinks. (Investors reduce the riskiness of their investments as they approach retirement). So all other things being equal – that is, among investments or projects with similar expected gains - you would like to minimize volatility in your portfolio. Same return but less chance of losing money on any given day, month or year.
Of course the problem is that there is another effect that works in the opposite direction: if you limit yourself to low-risk securities, you'll be limiting yourself to investments that tend to have low rates of return. So what you really want to do is include some higher growth, higher risk securities in your portfolio, but combine them in a smart way, so that some of their fluctuations cancel each other out. (In statistical terms, you're looking for a combined standard deviation that's low, relative to the standard deviations of the individual securities.) The result should give you a high average rate of return, with less of the harmful fluctuations.
The science of risk-efficient portfolios is associated with a couple of guys (a couple of Nobel laureates, actually) named Harry Markowitz and Bill Sharpe.
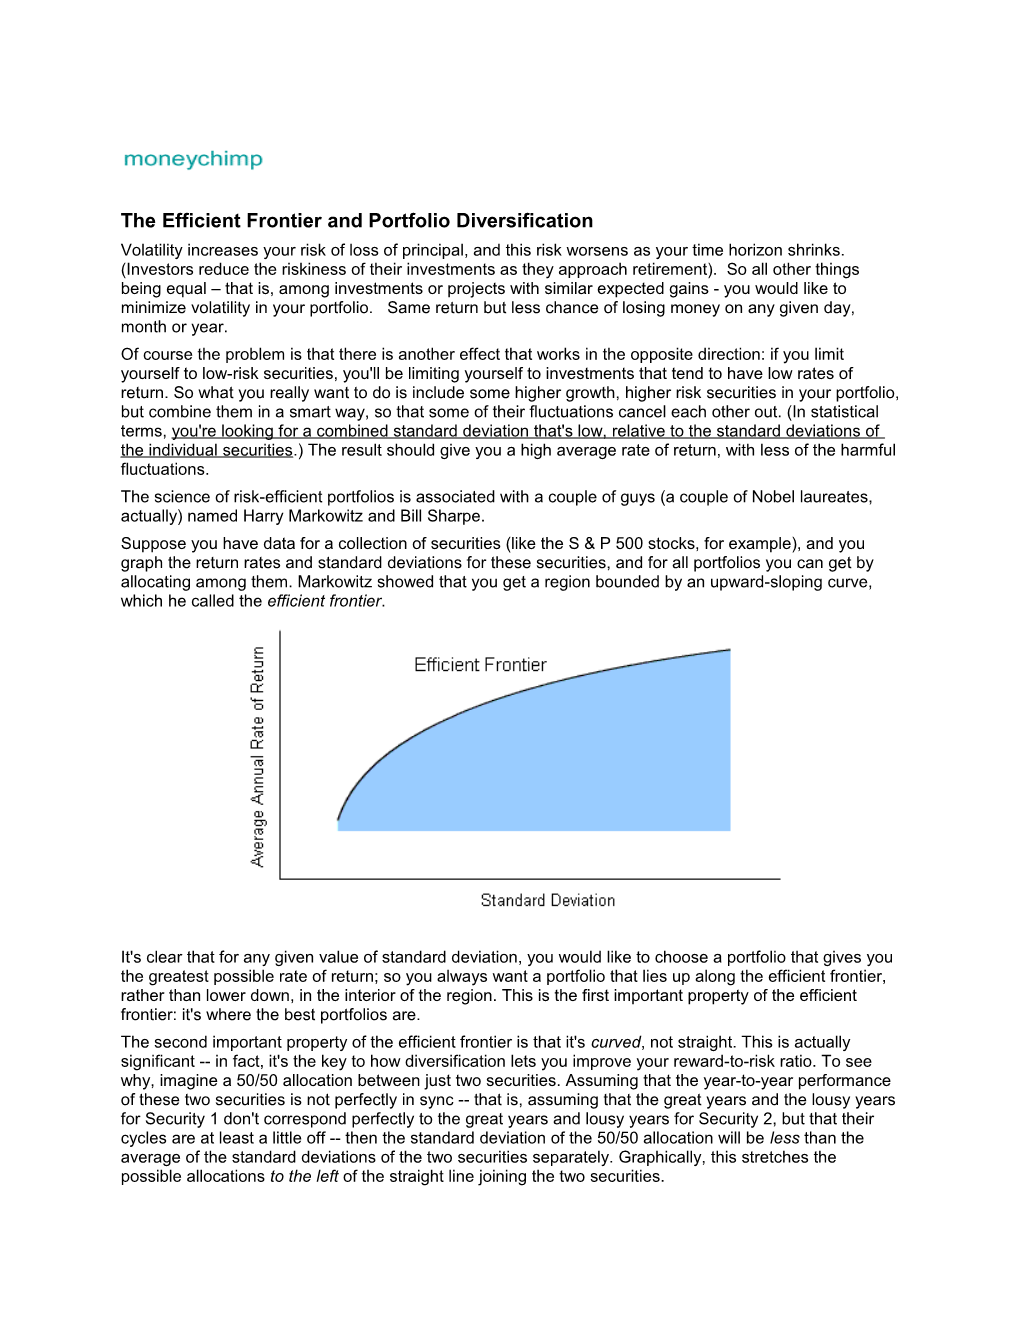
Suppose you have data for a collection of securities (like the S & P 500 stocks, for example), and you graph the return rates and standard deviations for these securities, and for all portfolios you can get by allocating among them. Markowitz showed that you get a region bounded by an upward-sloping curve, which he called the efficient frontier.
It's clear that for any given value of standard deviation, you would like to choose a portfolio that gives you the greatest possible rate of return; so you always want a portfolio that lies up along the efficient frontier, rather than lower down, in the interior of the region. This is the first important property of the efficient frontier: it's where the best portfolios are.
The second important property of the efficient frontier is that it's curved, not straight. This is actually significant -- in fact, it's the key to how diversification lets you improve your reward-to-risk ratio. To see why, imagine a 50/50 allocation between just two securities. Assuming that the year-to-year performance of these two securities is not perfectly in sync -- that is, assuming that the great years and the lousy years for Security 1 don't correspond perfectly to the great years and lousy years for Security 2, but that their cycles are at least a little off -- then the standard deviation of the 50/50 allocation will be less than the average of the standard deviations of the two securities separately. Graphically, this stretches the possible allocations to the left of the straight line joining the two securities.
In statistical terms, this effect is due to lack of covariance. The smaller the covariance between the two securities -- the more out of sync they are -- the smaller the standard deviation of a portfolio that combines them. The ultimate would be to find two securities with negative covariance (very out of sync: the best years of one happen during the worst years of the other, and vice versa).
From
Discussion questions:
- Standard Deviation is used as a measure of ______.
- When the term risk is used in describing investments, it is describing the risk of ______at any given point in time.
- Explain why, and in what situations, having a lower standard deviation is will be very beneficial to an investor.
- What is meant by the statistical terms covariance orcorrelation?
- If two securities have a low or negativc covariance or correlation, will putting them together in a portfolio likely increase or decrease the investor’s standard deviation?
- The strategy of mixing many securities or asset classes to reduce covariance is known as ______and is a very important factor in managing the risk of a portfolio.
- Name two stocks or asset classes that you believe have a low or negative correlation. ______.
