Election Project
Intro Packet
Goal: To use mathematics to help us predict who will win the 2004 U.S. Presidental Election
Steps:
- Learn the basics about this election
- Learn the math we need to make our predictions
- Survey people to find out their opinions about major election issues
- Organize & analyze the data collected in our survey to make our predictions
- Create a book that displays our learning and our conclusions!
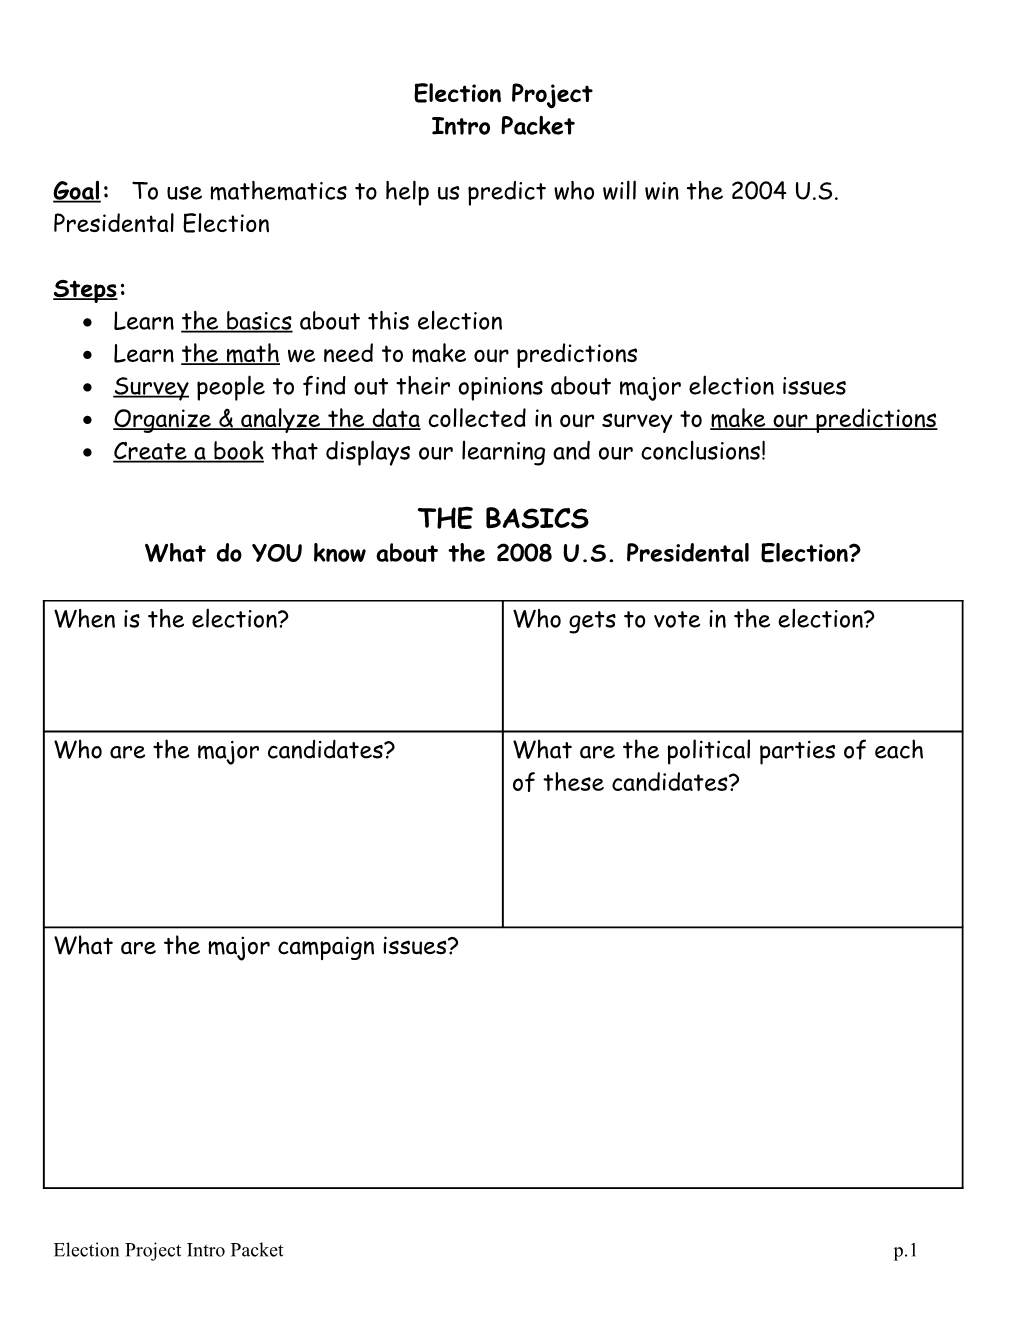
THE BASICS
What do YOU know about the 2008 U.S. Presidental Election?
When is the election? / Who gets to vote in the election?Who are the major candidates? / What are the political parties of each of these candidates?
What are the major campaign issues?
VOCABULARY
What do you think the following words mean?
WORD / EXAMPLE / EXPLANATION IN YOUR WORDSCandidate
Political party
Major
Issue
Campaign
YOUR IDEAS
How do people decide who to vote for?Why do people choose to vote for one person and not another?
What are the opinions of American voters?
What do you PREDICT these groups would say about these major election issues
Write SUPPORT or OPPOSE in each box.
Keeping abortion legal / Amnesty for illegal immigrants / Stronger governmental gun control / War in Iraq / Gay rightsMales
Females
Blacks
Latinos
Whites
Asians
People in Manhattan
People in the Bronx
Homework: Find out ______’S opinion and ______’s opinion on ______
Tomorrow: Ask your classmates what they found out for homework and use it to fill in the following chart with the words SUPPORT or OPPOSE.
CANDIATE #1 name hereCANDIATE #2 name here
DEMOGRAPHIC GROUPS
We know what GROUPS are, but what does DEMOGRAPHIC groups mean?
Demographic Groups / ExamplesGENDER
AGE
RACE
EDUCATION
INCOME
COUNTRY OF ORIGIN
URBAN, SUBURBAN, OR RURAL
Why are we talking about demographic groups in this project?
STEPS to PREPARE
Steps to prepare…
#1—Identify important issues in this year’s US presidential election#2—Learn more about these issues & learn what the 2 major candidates think about them
#3—Choose the issues that we are most interested in
The issues that are most interesting to our class:
My group will be working on the issue of: ______
#4—Choose the demographic groups whose opinions we are most interested in
The demographic groups that are most interesting to our class:
My group will be looking at the demographic group of ______.
#5 Predict the opinions of these groups about our election issues.
I predict that my group of ______will SUPPORT / OPPOSE the issue of
______
#6 Survey people to find out their opinions.
(Survey means:______)
#7 Analyze their answers to see if our predictions were correct and to see who we think these groups will vote for in the election….
FOR THIS WE NEED MATH!!!
ROUGH DRAFT OF ELECTION SURVEY DATA & ANALYSIS
Data collected from ______
(demographic group)
about their opinions on
______
(issue)
Name:Partner(s):
Class:
List all of your data here. In other words, list all the different responses from you surveys:
NOTES:
1 means ______strongly oppose______
2 means ______
3 means______
4 means______
5 means______
Organize your data into this table:
QuantitativeData / Qualitative
Response / Number of people in your group who said this
1
2
3
4
5
Total
What is the MODE of your data? ______Why?
What was the opinion of most______
(group)
about ______?
(issue)
What is the MEDIAN of your data? SHOW YOUR WORK!!!
What is the MEAN of your data? SHOW YOUR WORK!!!
SUMMARY of mean, median, mode of your data
Tell me again, what did you find for the:
Mode:______Median:______Mean:______
What is the QUALITATIVE INTERPRETATION for each of these?
Mode:______Median:______Mean:______
______
Do you think the MODE is the best representative of ALL the responses that your group gave? YES NO
Why or why not?
Do you think the MEDIAN is the best representative of ALL the responses that your group gave? YES NO
Why or why not?
Do you think the MEAN is the best representative of ALL the responses that your group gave? YES NO
Why or why not?
DISPERSION of data
Sometimes the mode, the median, and the mean are NOT good representatives of data.
Sometimes it is not interesting to pick just ONE data item to represent the others.
Instead, it can be useful to look at the DISPERSION of the data.Dispersion means…
1. What is the range of your data? ______
2. Make a BOX & WHISKER PLOT of your data (practice on a 8 ½ x 11 paper, then use a large brown paper).
3. Mark the mean & the mode on the number line below your the box-and whisker plot.
4. Describe the dispersion of the data around the medianElection Project Intro Packet p.1
