CST 594_Paper review
Qing Liu
Interactive overlays: A new method for generating global journal maps from Web-of Science data
By LoetLeydesdorff & Ismael Rafols
Published on Journal of Informatrics (2012), 6(2), 318-332
Citation count: 18
The goal of this study is to generate an interactive global map at the journal level. The cons and pros of the various options have been compared: cited versus citing, multidimensional scaling versus spring-embedded algorithms, VOSViewer versus Gephi, and the various clustering algorithms and similarity criteria.
Visualization techniques
The problem encountered with the analytical implications of parameter choices is that, visualization necessarily involves the reduction of a multidimensional space into two dimensions of a sheet or screen. Two solutions to the problem of the projection to a two-dimensional map have been discussed: multidimensional scaling (MDS) based on stress-minimization and minimization of an energy function in the graph conceptualized as a system of springs. Conceptually, the difference between these two solutions is that spring-embedding is a graph-theoretical concept developed for the topology of a network. The weighing is achieved for each individual link. MDS operates on the multivariate space as a system, and hence refers to different topology.
Methods and data
The data for this study was harvested from the Internet version of the Journal Citation Reports 2009 in August 2010. On the basis of this data an aggregated journal–journal citation matrix of 9162 journals was constructed. Of the 91622 = 83,942,244 cells only 2,790,876 (=3.32%) are filled with values larger than zero; the grand total of the matrix is 33,190,645 citations, or on average 11.89 per cell with a value larger than zero.
The matrix was transformed (Using SPSS) into a cosine-normalized matrix both in the being-cited and the citing dimensions. Matrices with the thresholds for the cosine values can then be exported in formats that can be read by the various visualization programs.
Two packages, VOSViewer (based on an MDS-like algorithm) and Gephi (containing a spring-embedder), were used and compared for visualization. VOSViewer was preferred for two reasons: 1) the problem of cluttering of the labels is solved in VOSViewer, and 2) the layout is based on stress-minimization as in multidimensional scaling (MDS) whereas Gephi uses a spring-embedder.
Results
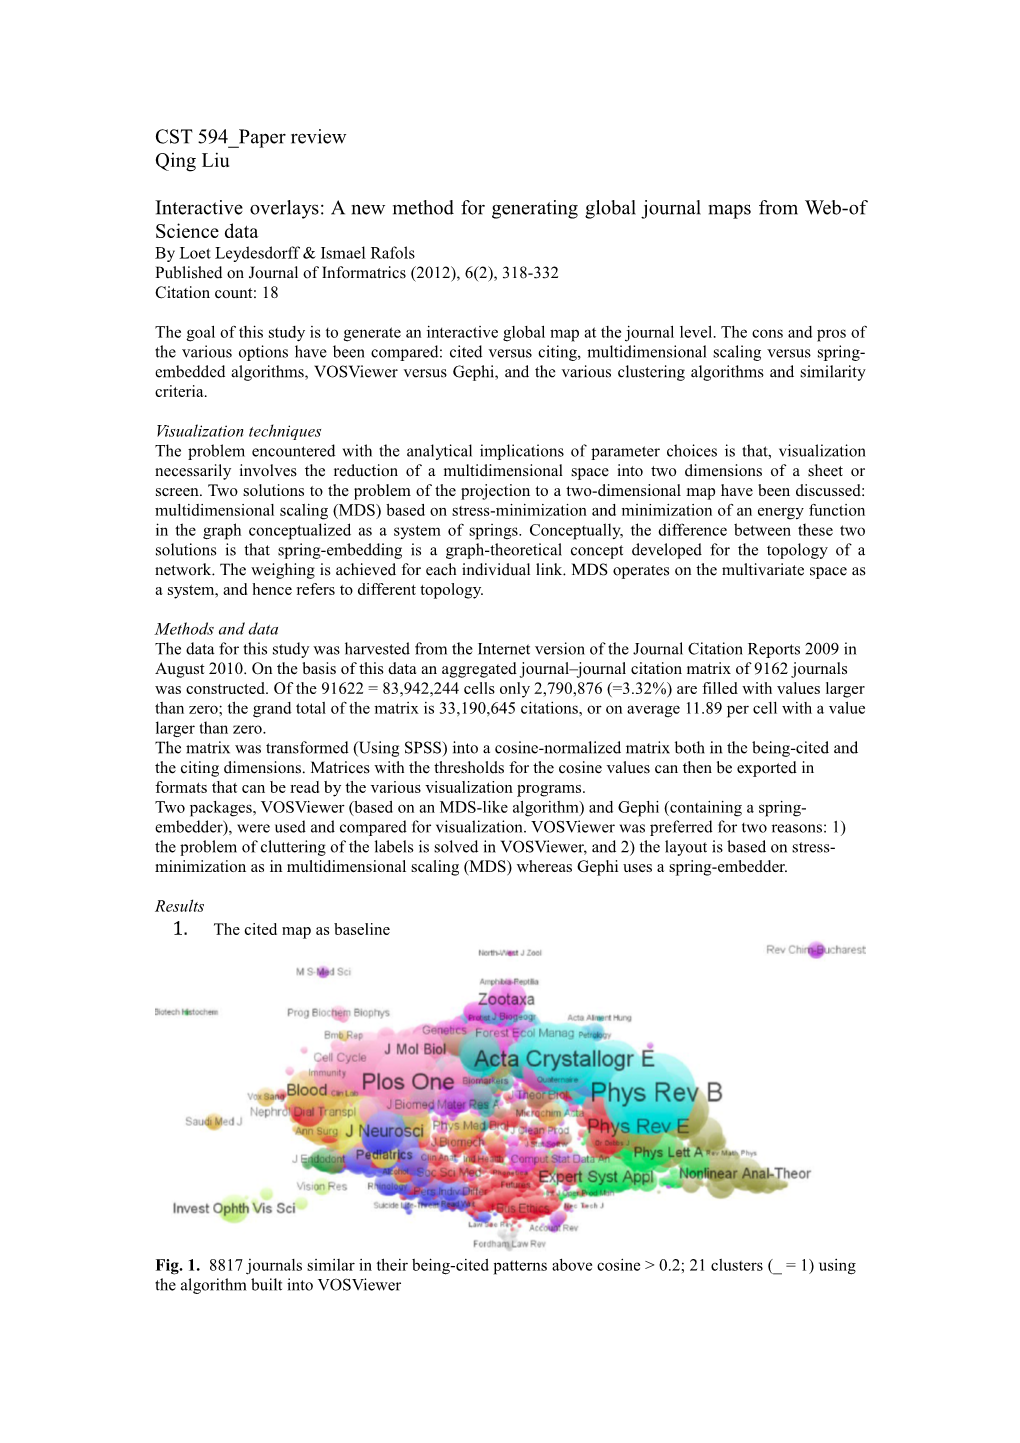
- The cited map as baseline
Fig. 1. 8817 journals similar in their being-cited patterns above cosine > 0.2; 21 clusters (_ = 1) using the algorithm built into VOSViewer
- The citing map as baseline
Fig. 2. 8860 journals similar in their citing patterns above cosine > 0.2; 19 clusters (_ = 1) using the algorithm built into VOSViewer (Van Eck et al., 2010).
(At _ = 1.5 and _ = 2, the number of clusters are 77 and 121, respectively.) (Sizes of the nodes correspond to numbers of publications in 2009.)
- The overlay map
Fig. 3. Overlay map of 168 articles published by the first author (Leydesdorff) in journals included in the ISI journal set.
Application: mapping interdisciplinary organizations and fields
This overlay methods was tested in two areas of contestation about the function of interdisciplinarity: 1) the assessment of interdisciplinary units such as university departments, and 2) the delineation of newly emerging specialties such as nanoscience and nanotechnology.
- Innovation studies verses business & management schools
Fig. 4. (a and b) Overlay maps comparing journal publication portfolios from 2006 to 2010 between the London Business School (on the left) and the Science and Technology Policy Research Unit SPRU at the University of Sussex (on the right).
- Nanoscience and nanotechnology
Fig. 5. Main factors in the journal set of Nanoscience and Nanotechnology, overlaid on the cited map.
The authors concluded that VOSViewer could serve as a platform for journal overlays. The positions in the multidimensional space enable users to specify the position of the communication from a systems perspective. Furthermore, the cosine is a spatial measure well suited to map the multidimensional space.
I chose this paper because I am currently working on a project that aims to design a web-based knowledge mining and interactive visualization platform. Visualization of maps of journals is one core feature of this platform. This paper provides a clear view on the difference between multidimensional scaling algorithm and spring-embedded algorithm. Furthermore, after comparison, the authors concluded thatVOSViewer, which is based on an MDS-like algorithm, is a better choice for the purpose of generating global map at the journal level.